


Chasing Yield In A Bear Market Is Easy When It Accelerates Income Growth – Seeking Alpha
Most investors are fearful of market declines. I embrace them as the best opportunity to enhance my income growth.
DNY59/E+ via Getty Images
Most investors are fearful of market declines. I embrace them as the best opportunity to enhance my income growth.
DNY59/E+ via Getty Images
Warren Buffett’s “Rule No. 1 Never lose money. Rule No. 2: Never forget rule No. 1.” Most people reference this rule to investment principle, but for me this rule pertains to dividend income. This rule is simple to implement, because when I reinvest surplus dividends, this method prevents me from ever losing money. The more the market declines, the higher my disposable cash generates income.
I can research past financial results and pick good stocks that should perform well. The final results always come back to the price I pay for the investment. I have recently solved this conundrum with software to automatically determine the psychology of the market.
It took 5 years to build the software, but now I receive email alerts and portfolio updates during market hours. I can determine my trading action each day in real-time.
In this article I present September 29, 2022 market decline where most of my stocks went into oversold territory. I received many Email alerts that day and took advantage of multiple purchases.
This article illustrates investments made using the TEA/POT (Trade Email Alert / Portfolio Online Tracker) software developed for capturing market declines and sending Email Buy-Alerts to my cellphone.
The trade signals are based on the RSI (momentum indicator) and price Z-score (standard deviation), see Appendix-A for more information. Both indicators are calculated from a year’s worth of price data. I have my quote updates set for 1-minute ticks where the RSI and Z-score is recalculated in real time.
I’ve been saying all along, fundamental analysis is half the battle. The other half is technical analysis, where price movement is based on perception. Price will always be fluid, manipulated by forces outside of the investor’s control.
We own stocks based on our individual investment method and use fundamental analysis to hold good investments. Recently, everyone’s portfolio has been experiencing price declines with the general market.
The sooner you realize this fact about price, the sooner an investor can use volatility to their advantage. The best we can do at this point is to go with the flow, and when price provides good entry points, the investor should plant seeds (purchase more shares) to grow their future income.
FDUS, GBDC, GSBD, TSLX, HTGC, TPVG, CSWC, OCSL, ARCC
BXMT, ABR, PMT, STWD, ACRE
PDI, PTY, PFL, GOF, ECC, ARDC, WDI
All companies listed above are RIC (Regulated Investment Company) investments. They are pass-through companies that avoid double taxation. The income tax is passed to shareholders as ordinary income most suitable in a tax shelter. Use RIC investments in an IRA or ROTH account, and the portfolio should grow fast.
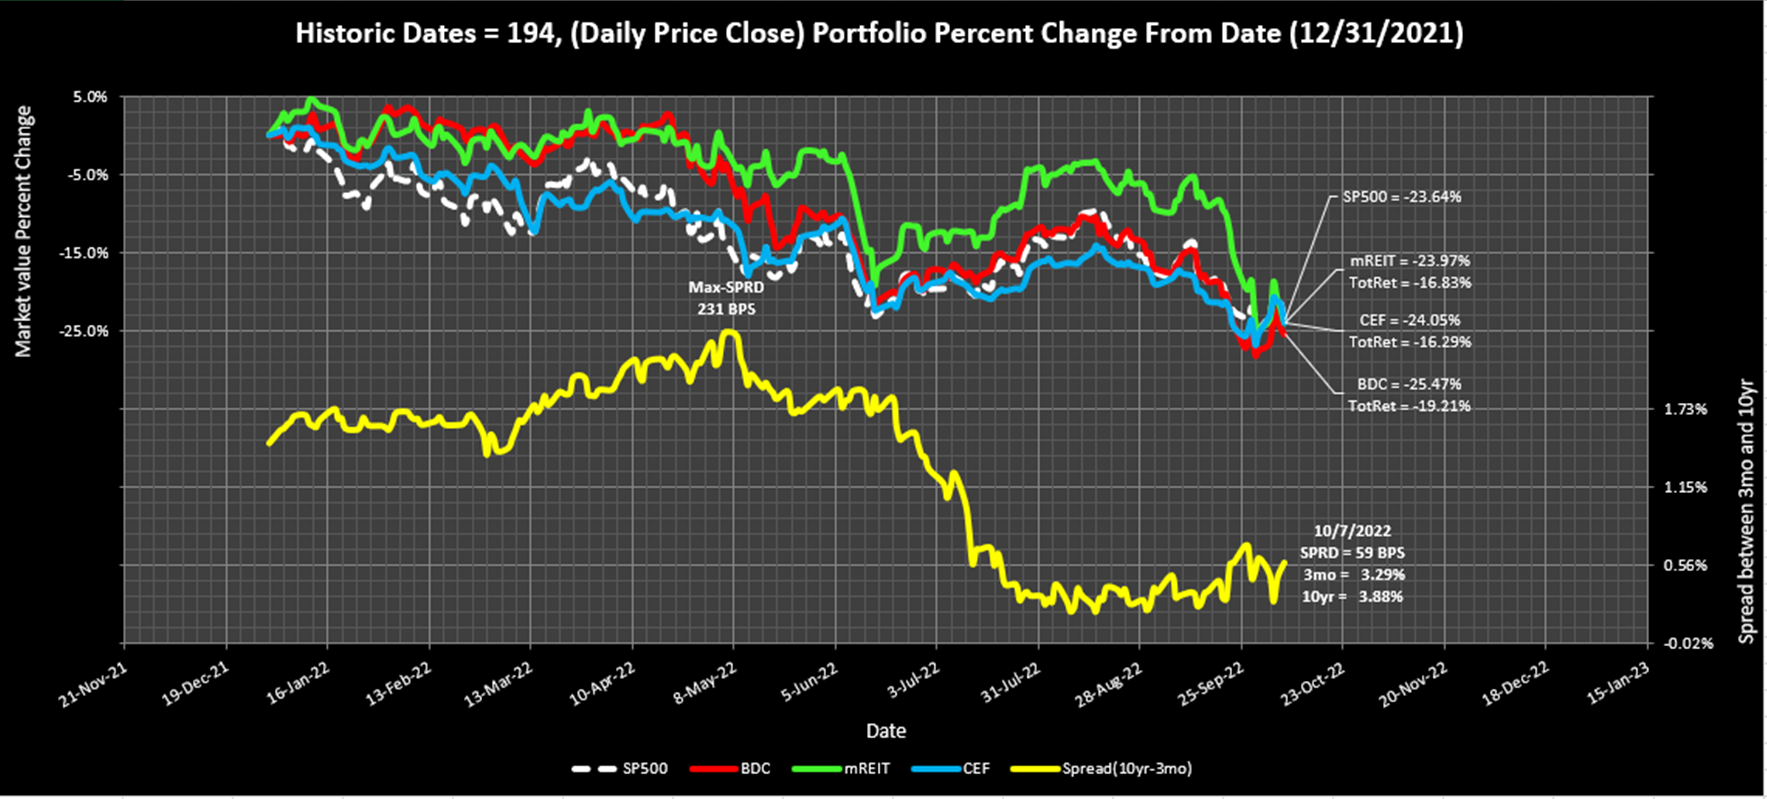
Chart-1, YTD three groups; mREIT, CEF and BDC
Authors TEA/POT software
Authors TEA/POT software
This chart displays my three groups of stocks identified in the list above. As of October 7, 2022 the S&P 500 is down about 24%. My mREITs are down about 24%, CEFs down 24% and BDCs are down 25%. If I add the dividends to the group of stocks for total return, mREITs are down about 16%, CEFs down about 16% and BDCs down about 19% – still beating the S&P 500 with its miniscule 1.5% yield.
This is why I target a portfolio 10% yield, to stay above inflation and to reinvest extra dividends. I’ve been doing this for almost a decade now, and this method increases income growth especially in a bear market. Cash flow is the same attribute I’ve used during my working career, why change now!
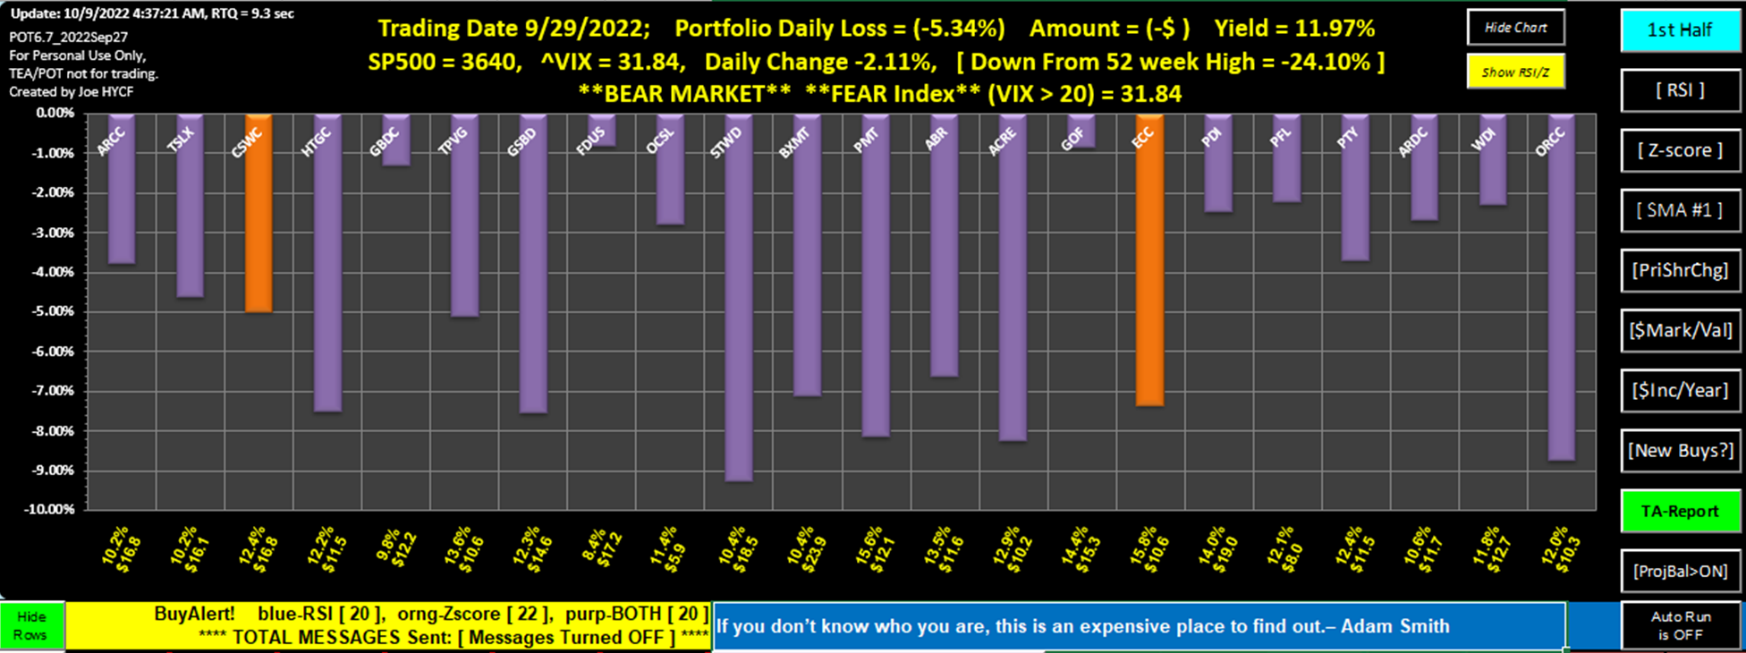
Chart-2 shows my POT (Portfolio Online Tracker) of my current portfolio on September 29th. As a contrarian to price declines, I enjoyed the 5% portfolio loss. The safest decline in price is when all stocks move together in one direction.
Chart-2, High-Yield Price Change
Authors TEA/POT software
Authors TEA/POT software
On September 29th, there were many holdings indicating oversold status. The purple bars indicate both RSI and Z-score entered the buy zone. The orange bars indicate the Z-score was triggered and not the RSI. My setpoints for RSI is less than 30 and Z-score less than -1. Please see Appendix-A for explanations of both indicators.
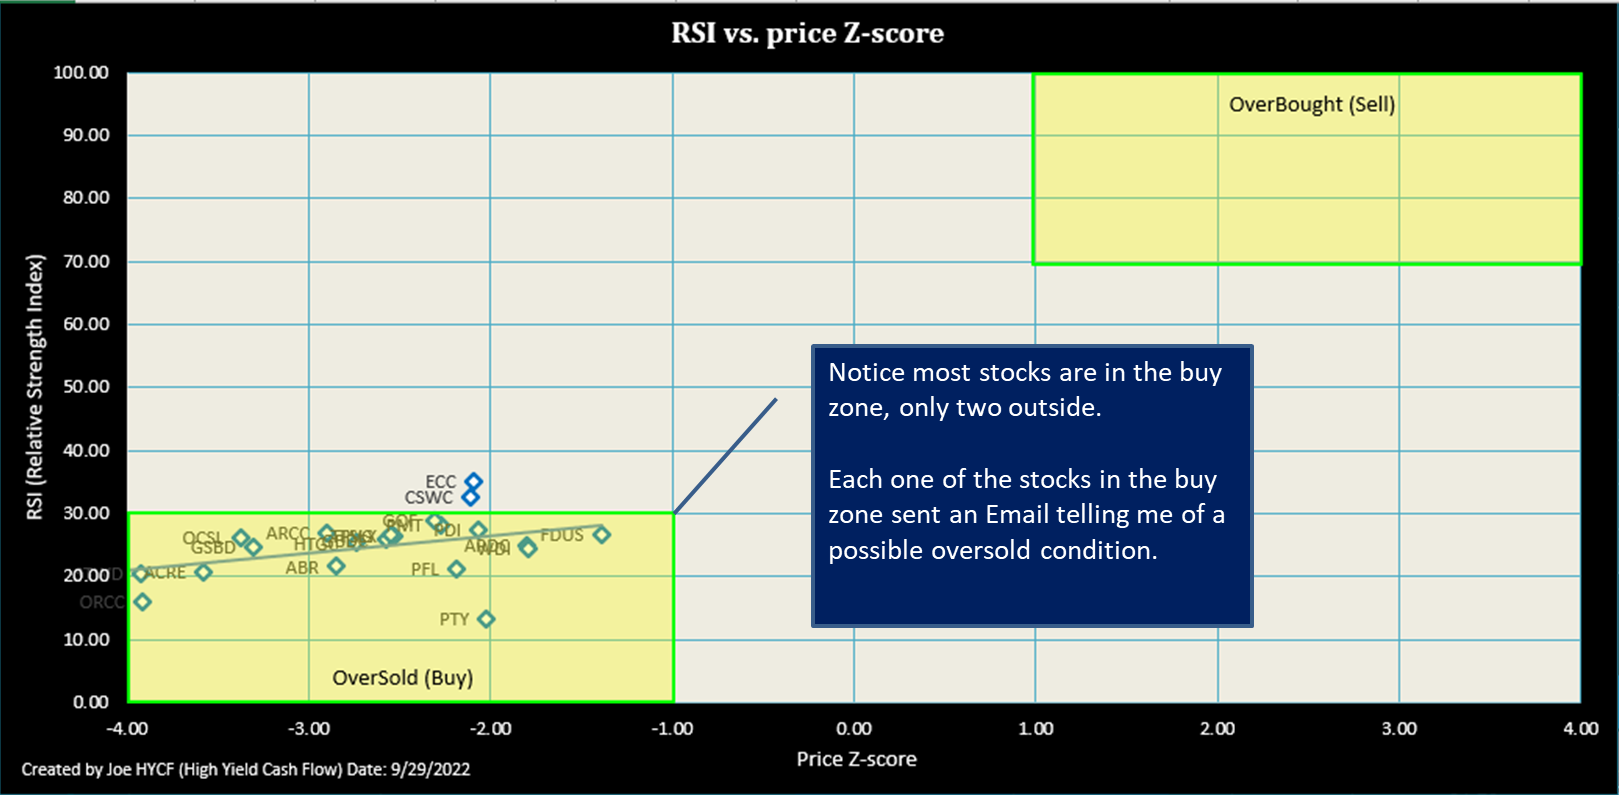
Chart-3; Over-Sold and Over-Bought window
Authors TEA/POT software
Authors TEA/POT software
Chart-3 is a new chart I have installed in the TEA/POT software. With a simple push of a button, I can tell where any of my stocks reside in the oversold and overbought zone. When my Email alert system is activated, this chart will be sent to my cellphone along with a daily stock status report.
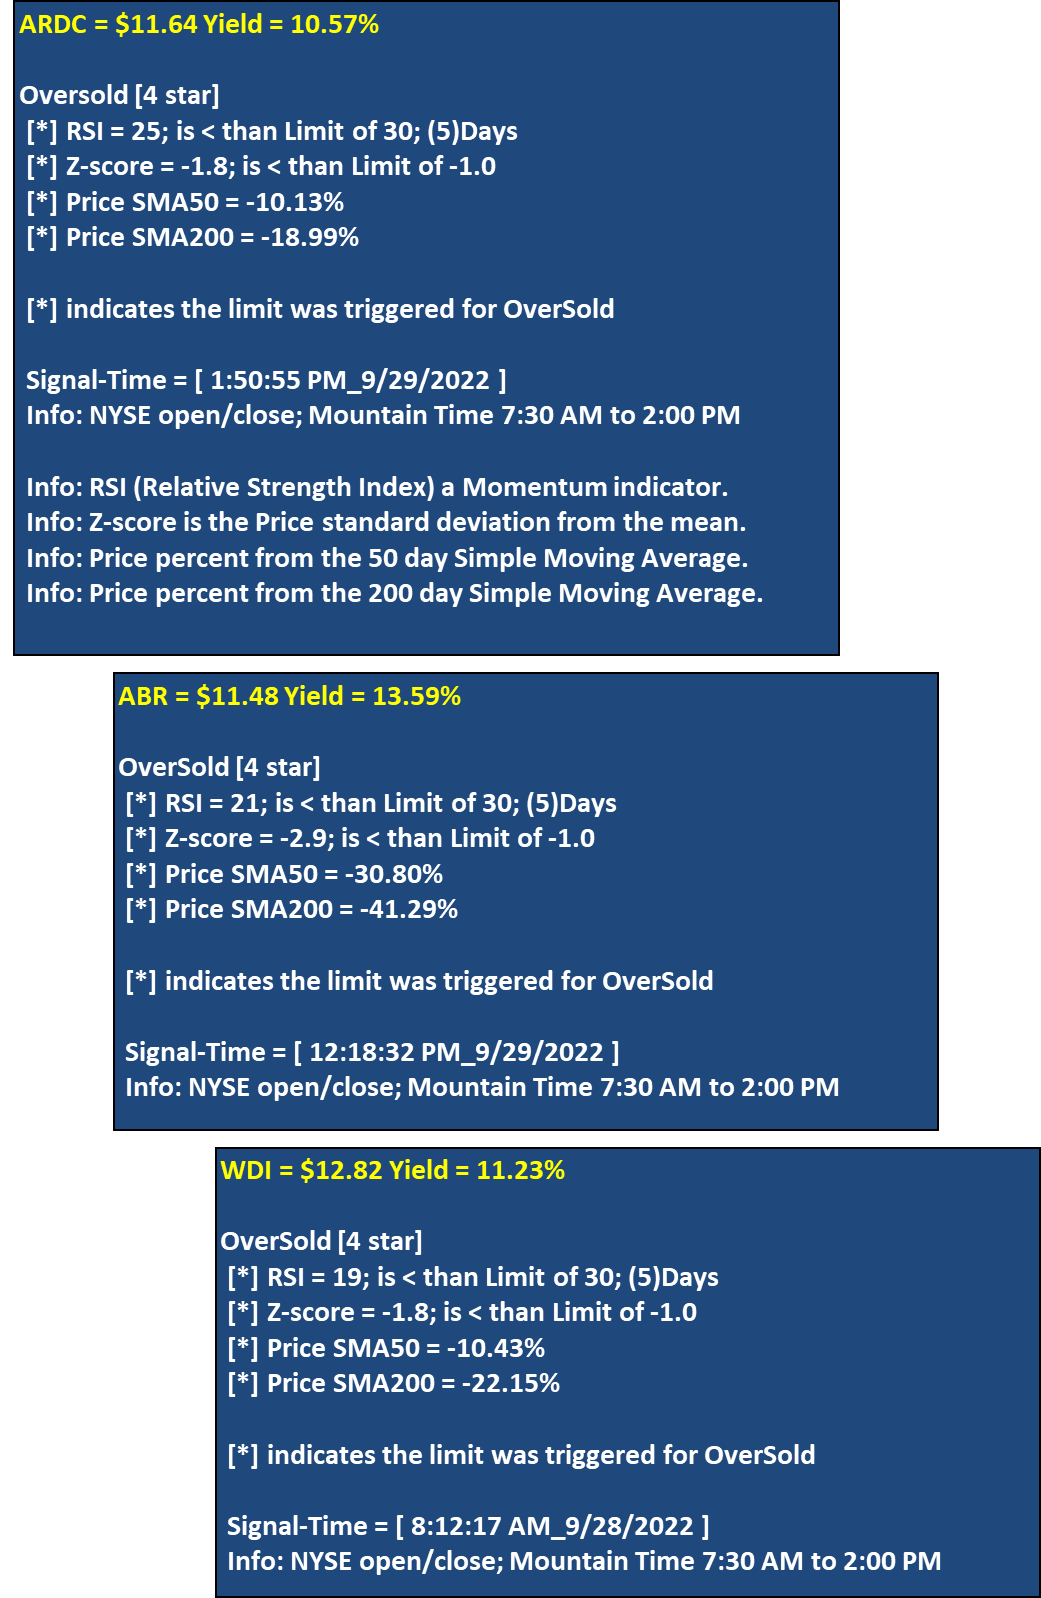
I received many oversold alerts September 29th and took advantage of three stocks: ABR, ARDC and WDI. I have been doing this type of purchasing all year based on my Email-Alert system.
This has been extremely effective keeping my purchasing out of the neutral zone (between oversold and overbought) and buying when in the oversold zone.
Figure-1, actual Email Alerts Received
Authors TEA/POT software
Authors TEA/POT software
The following table indicates my purchase September 29th and 3 days later October 4th. The last column shows how buying shares when receiving a trade alert increases the odds of buying when everyone is selling.
I don’t guess at price, but instead wait until I get an active buy signal. This type of action always happens, the criterion for this method requires patience and time to take advantage. We will see price volatility the rest of the 2022 year.
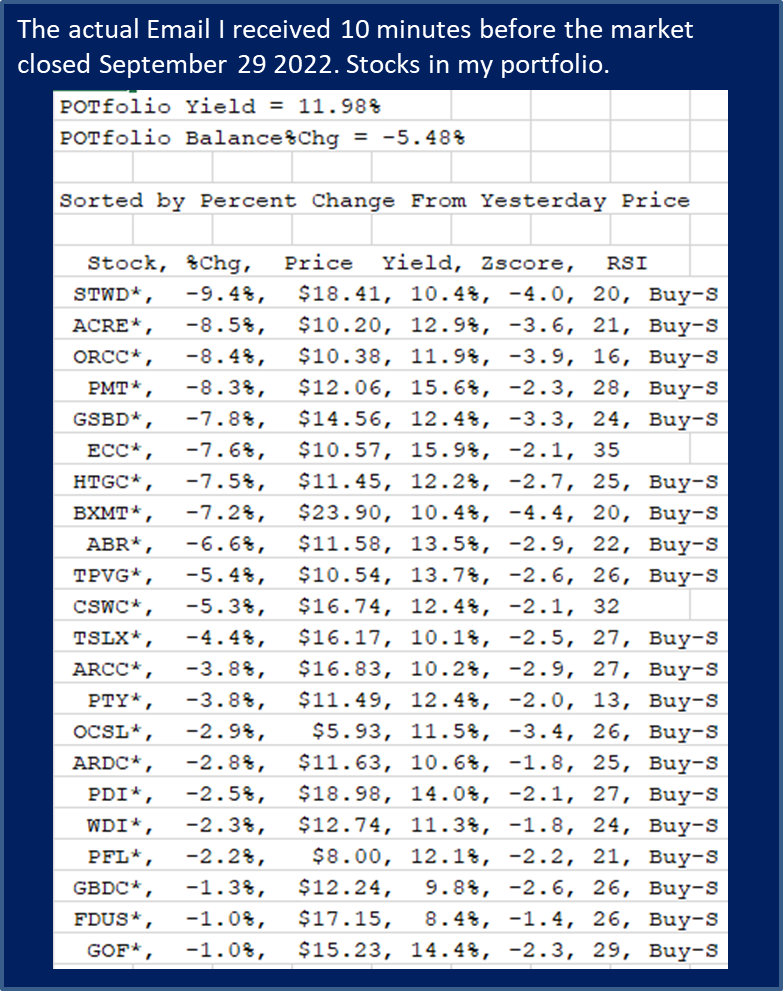
The following table is automatically sent to my cell phone 10 minutes before the market closes. You can see the massive price declines where people were dumping stocks in fear. This type of massive decline brought my portfolio yield up to almost 12%, and last year this same portfolio was yielding just 8%. What a wonderful time to be in this market, everything on sale for those who like to go bargain hunting.
Figure-2
Authors TEA/POT software
Authors TEA/POT software
Figure-2 is sent to my cellphone 5 times a day to keep me informed of my portfolio status. Along with the Trade Email Alerts, I like to see what the rest of my holdings are doing.
As showed from this Email, the price change along with yield and technical parameters are included for evaluation. The last column with the “Buy-S” indicates a strong buy because both the RSI and price Z-score have exceeded their trigger levels.
As a side note: during the day of September 29th, I was running errands around town and was notified by email of multiple trade-alerts. In real-time I made the trades listed above on my cellphone. I do not need to be tied to my PC to manage my portfolio, just the ability to read incoming emails.
After the June 16th decline, the market proceeded to rally. During this time, multiple people were saying that June 16th was the low for the year. I felt the FOMO (Fear Of Missing Out) emotional pull, since I was not buying anything at the time.
I had no buy alerts for two months and was thinking they were correct. Once September came around, the typical seasonality decline manifested itself and I was in good spirits, once again placing trades. I’m still getting used to this trading method, and so far, it has not let me down.
As shown in Chart-1, the S&P 500 and my holdings are all down around 24%. The only difference between the market and my holdings is the massive income generation. This year I have multiple stocks raising their dividends and paying specials along the way.
I have outlined the following Buy-Signals used by the TEA/POT software I currently use to enhance my trading experience.
RSI (Relative Strength Index)
The RSI number goes from 0 to 100 indicating oversold and overbought conditions. Every price quote taken during the day re-calculates the RSI level and notifies the investor of any meaningful change.
A good definition of RSI is from Investopedia:
“The relative strength index (RSI) is a momentum indicator used in technical analysis that measures the magnitude of recent price changes to evaluate overbought or oversold conditions in the price of a stock or other asset. The RSI is displayed as an oscillator (a line graph that moves between two extremes) and can have a reading from 0 to 100.”
Oversold and Overbought trigger points are user selectable in the POT application and initiate an email notification.
An RSI of less than or equal to 30 is suggested as oversold. This provides a quick evaluation of a possible purchase.
An RSI over 70 indicates the stock may be overbought and a possible trimming is in order.
Z-score, Price Standard Deviation
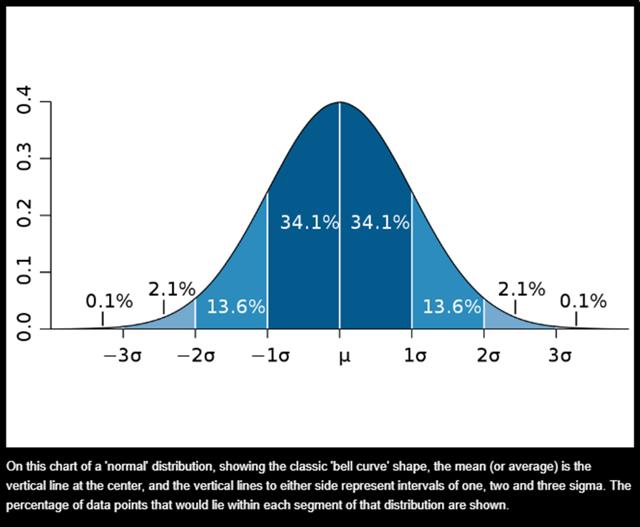
The diagram in Figure-1 demonstrates a normal distribution of data values. They can represent any dataset sorted from minimum to maximum. For the Z-score calculation I use one year’s worth of price data.
The percentage in Figure-1 is a range, based on the dataset of prices for each individual stock. To interpret a normal distribution in Figure-1 the stock’s price will remain in the blue shaded area 68.2% of the time within +-1 standard deviation. Visually you can see that when the Z-score becomes more negative, the price is entering an oversold condition.
Figure-1: Bell Curve
MIT News
MIT News
It must be noted the data representing price is not an absolute normal distribution, because price is very volatile. We can still use price representing a normal distribution that allows comparative results with other stocks. A single daily stock quote gives a good indication where price fits on the bell curve range.
When looking at the Bell curve Figure-1 diagram, the center value is the price mean. The calculated Z-score can vary above and below the mean to tell us how far away from the mean price has moved when receiving a quote. For my trigger point I use “-1” to signal an alert telling me the price has deviated from the mean. The larger the negative value, the greater the chances for a possible purchase after examining the rest of the technical parameters.
50 SMA and 200 SMA (Simple Moving Average)
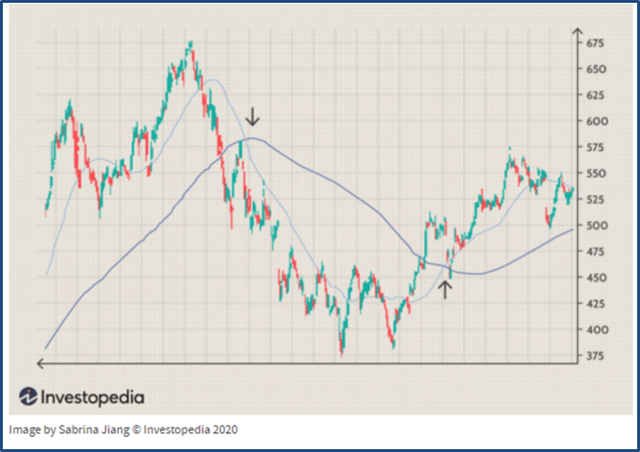
An explanation is outlined by Investopedia, using Moving averages to detect directional changes:
“Another strategy is to apply two moving averages to a chart: one longer and one shorter. When the shorter-term MA crosses above the longer-term MA, it’s a buy signal, as it indicates that the trend is shifting up. This is known as a “golden cross.” Right arrow in the chart.
“Meanwhile, when the shorter-term MA crosses below the longer-term MA, it’s a sell signal, as it indicates that the trend is shifting down. This is known as a “ dead/death cross.” Left arrow in the chart.
Investopedia
Investopedia
Left arrow indicates the 50-day SMA just went below the 200-day SMA, (death cross). Right arrow indicates the 50-day SMA went above the 200-day SMA (golden cross).
Both signals indicate a change in direction.
This article was written by
Disclosure: I/we have a beneficial long position in the shares of ALL STOCKS either through stock ownership, options, or other derivatives. I wrote this article myself, and it expresses my own opinions. I am not receiving compensation for it (other than from Seeking Alpha). I have no business relationship with any company whose stock is mentioned in this article.
Additional disclosure: I am not a financial adviser, but an independent investor. Please note the stocks included in this portfolio are not recommendations. They were personally selected by the author and contain a great deal of investment risk. The stocks in the portfolio are BDCs, mREITs and CEFs. All Investment vehicles are “Regulated Investment Companies” and required to distribute at least 90 percent of their earnings as dividends. The Trade Email Alert system is for information purposes only, and should not be used for making any financial trading decisions.